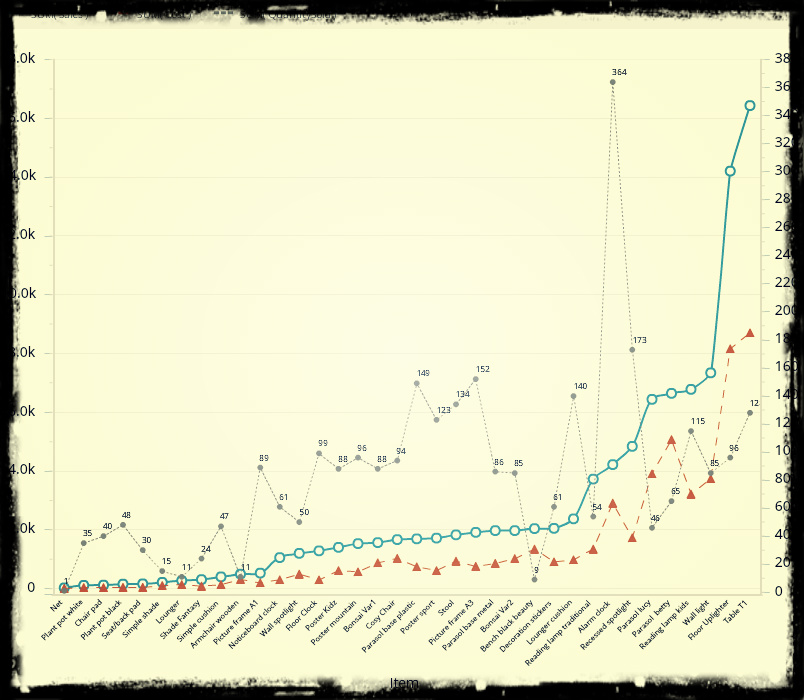
You have the data, but lack the expertise to visualize it?
WE CAN HELP.
Qualia Data Sciences will work with you to make sure that your data will be presented appropriately. Each data set contains a wealth of information. This information lies hidden in them as long as data are not presented intuitively.
Proper selection of data visualization will allow data to tell its story.
DATA VISUALIZATION PROJECTS
We offer you the most appropriate visualization prototype that will correspond to business question. During its construction, we will consider several design principles and methods of user interaction with the visualization. After development the concept goes to the user testing and approval.
Once we agreed upon design and visualization dynamics, we will develop a prototype to the end and adjust it to your specific data and production environment.
CONSULTANCY
If you or your company have problems with communicating quantitative information we offer you our professional advice. Maybe you are
- unsure how to present the data, in form of table or chart?
- don’t know what is relevant and what data to include in report?
- not certain which graph to use to best tell your audience what is going on?
WE WILL
- educate you about data visualization principles
- explain to you what types of graphs to use, when and why
- make sure that you learn to avoid producing a chart junk
- review your reports and suggest any improvements
- help you to define your reports and information dashboards
